Insurance agents are running businesses on tools never built for them
Point of Sales Persons (POSPs) are the frontline of insurance distribution in India — licensed agents who sell, manage, and renew policies directly with customers. They're running small businesses under a larger insurer's umbrella, which means they need tools that help them sell, stay organised, and grow their client base.
The reality? Most were stitching together a legacy portal that handled some transactions and Excel spreadsheets that tracked everything else — client details, policy expiry dates, lead follow-ups, commission records. Nothing talked to anything else. Every insight required manual work.
Design a unified insurer platform for four user roles — sales agents (POSPs), operations staff, admins, and relationship managers — that consolidates policy management, client tracking, lead management, and reporting into one coherent system. Research through handoff. Solo.
Fragmented tools meant agents were doing admin instead of selling
The core problem wasn't just a bad interface — it was a fundamentally broken workflow. When your tools don't connect, you spend your day on data entry and reconciliation instead of selling policies and serving clients.
- Legacy portal for policy transactions only
- Client details tracked in personal Excel files
- Lead follow-ups managed through WhatsApp and memory
- No visibility into commission earned or pending
- Operations and admin using separate tools entirely
- No single view of business performance
- One portal for every agent task
- Client and policy data connected by default
- Lead pipeline with structured follow-up flows
- Commission and performance visible on the dashboard
- Operations and admin with purpose-built views
- Real-time business overview for each role
This platform needed to cover every major workflow an insurance agent, operations officer, admin, and relationship manager touches — without becoming bloated and complex. The challenge was simplifying multi-layered flows while ensuring nothing critical was left out. Every screen needed to earn its place.
Four roles. Four completely different ways of working.
Each portal needed to feel purpose-built — not like a generic dashboard with permissions toggled on and off. Understanding what each role actually does day-to-day was the foundation of every design decision.
What each role shares — and what makes them different
All four roles interact with policy and client data, but from completely different vantage points. A POSP cares about their own pipeline. An RM cares about their agents' pipelines. Operations cares about process accuracy. Admin cares about system health. The same underlying data needed to be surfaced differently for each. This shaped every navigation and layout decision across all four portals.
Understanding the insurance agent's actual workday
Stakeholder conversations
I worked with the client and PM to map out the full agent workflow — from lead acquisition through policy issuance, renewal reminders, and commission tracking. Understanding where agents were currently switching between tools told me exactly where the platform needed to reduce friction.
Benchmarking
I reviewed existing insurance distribution platforms, B2B SaaS dashboards for sales-heavy roles, and CRM tools used in adjacent industries (real estate, financial services) to identify what patterns worked for complex multi-entity data management — policy + client + lead all connected.
Most insurance portals are built around policies as the primary entity — you start with a policy and find the client attached to it. But agents think in terms of clients first. A good agent knows their clients' renewal dates, family situations, and coverage gaps — and sells from that relationship. The platform needed to reflect that mental model: client-centric, not policy-centric.
Every screen had to earn its place
The guiding principle throughout this project was ruthless simplification — covering every necessary flow with the fewest possible steps, decision points, and cognitive overhead. Insurance workflows are inherently complex. The platform's job was to absorb that complexity, not pass it to the user.
"Cover everything — but make it feel like nothing."
A platform that handles policy management, client management, lead management, user management, and performance reporting across four roles has enormous surface area. The risk was building something that felt like an enterprise tool from the 2000s — feature-complete but exhausting to use.
Every design decision was tested against a simple question: does this reduce the agent's time to task, or does it add to it? If the answer was the latter, we cut, combined, or deferred.
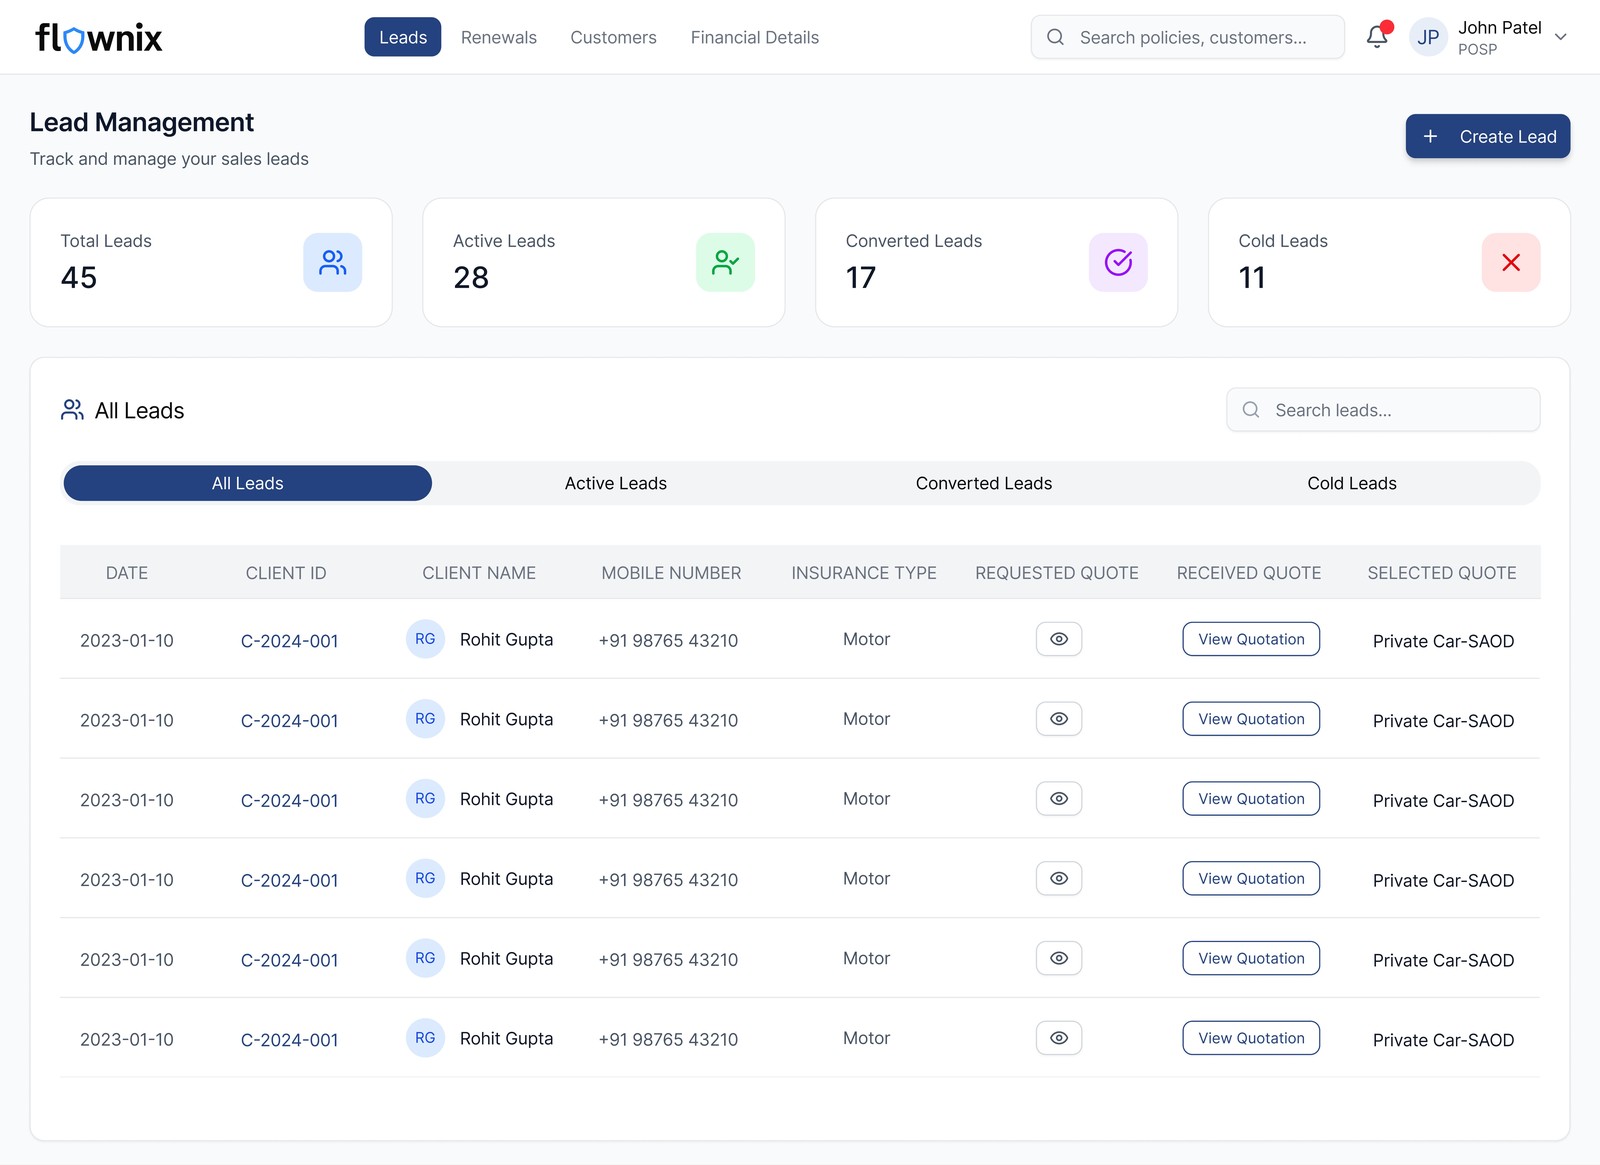
POSP portal — client-first, not policy-first
I restructured the primary navigation around the agent's mental model: clients, then policies, then leads. The dashboard surfaces the metrics that drive agent behaviour — policies sold this month, renewals due, leads in pipeline, commission earned. Everything actionable, nothing decorative.
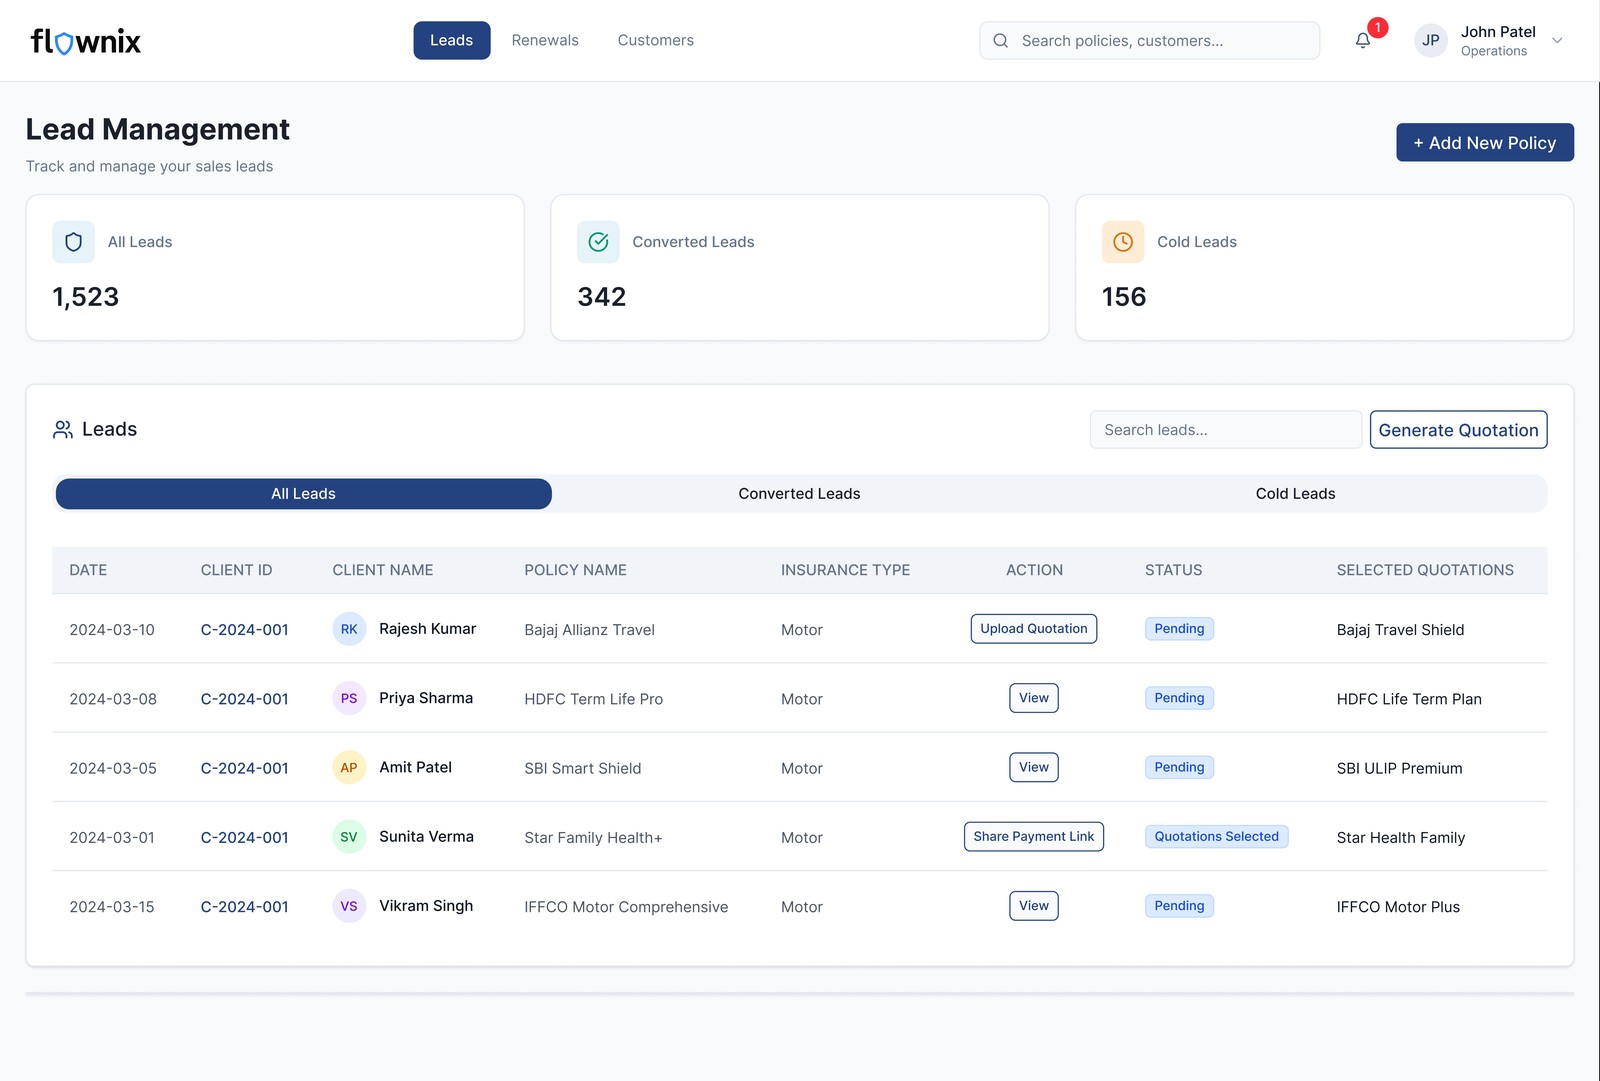
Lead management — structure without rigidity
Leads were previously tracked in WhatsApp and memory. I designed a lightweight CRM-style lead pipeline — stage-based (new → contacted → quoted → converted) with follow-up reminders — that felt familiar to agents already using basic sales tools, without requiring the learning curve of a full CRM.
Operations portal — process accuracy over speed
Operations users need to verify, approve, and process policy applications methodically. I designed a queue-based interface — applications arrive in a structured list, each with a clear checklist of verification steps. Status is always visible. Nothing gets lost in a pile.
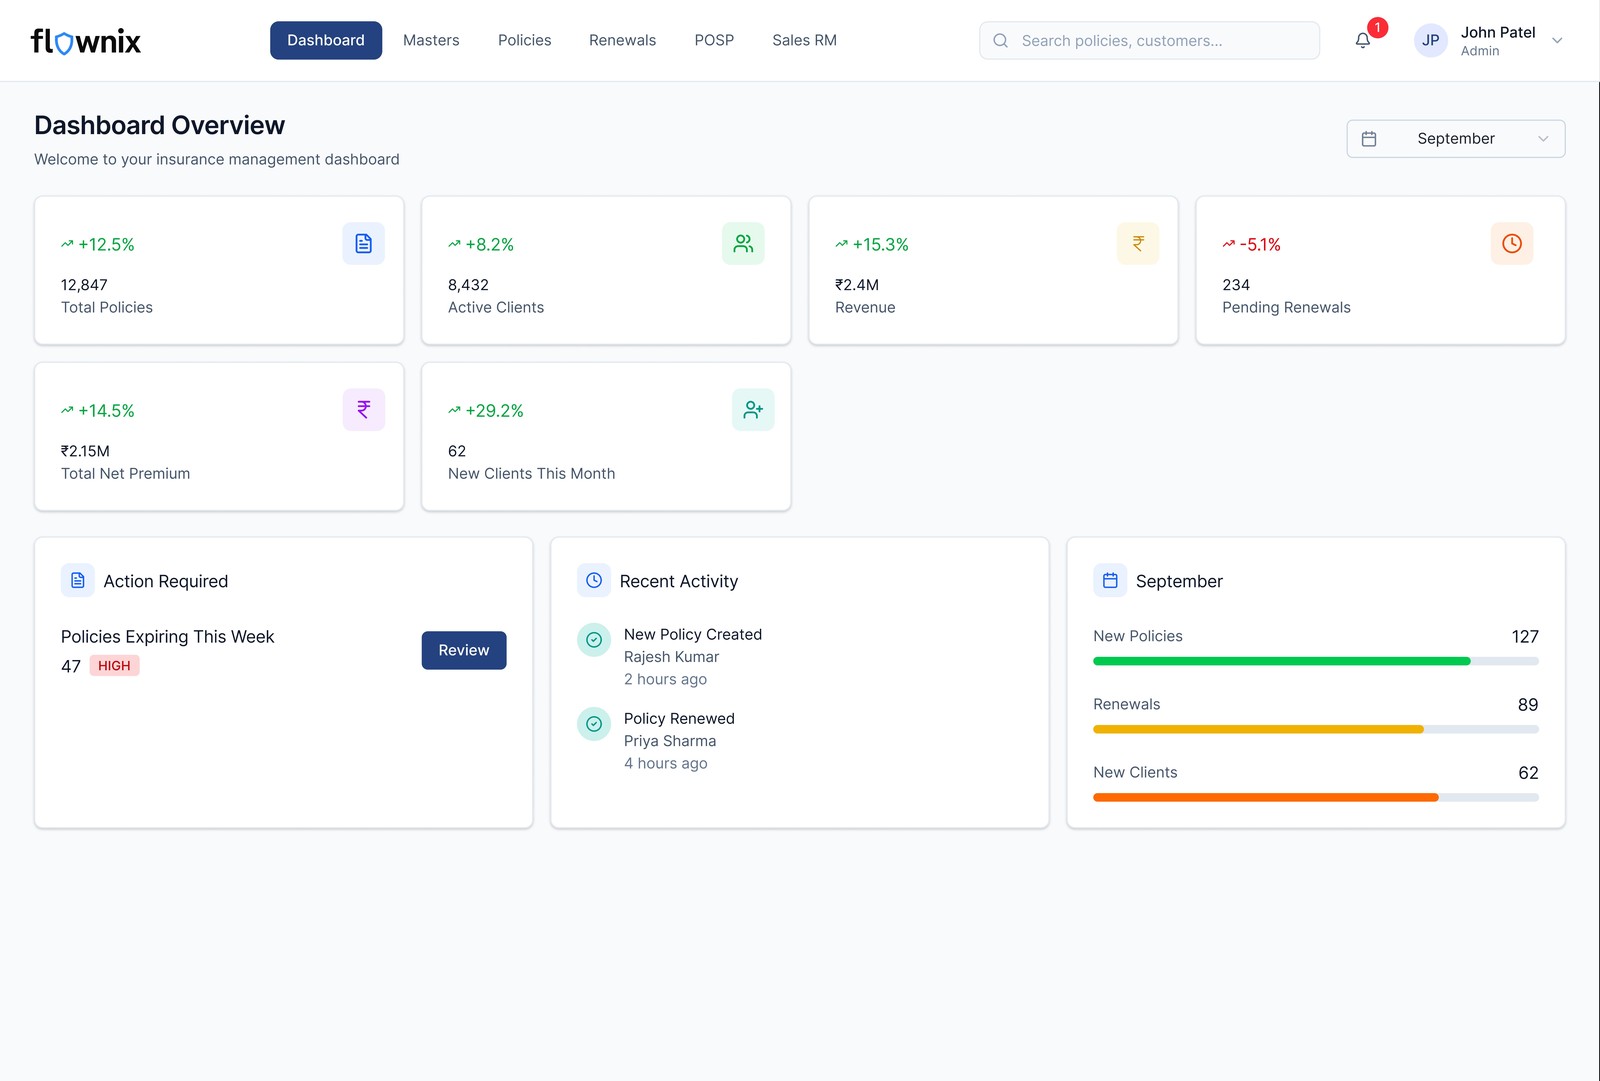
Admin portal — control without micromanagement
Admin users configure and oversee the platform. I kept the admin portal focused on user management and agent onboarding — the two tasks admins spend most time on — with platform configuration accessible but not front-and-centre. Clean tables, bulk actions, and clear status indicators throughout.
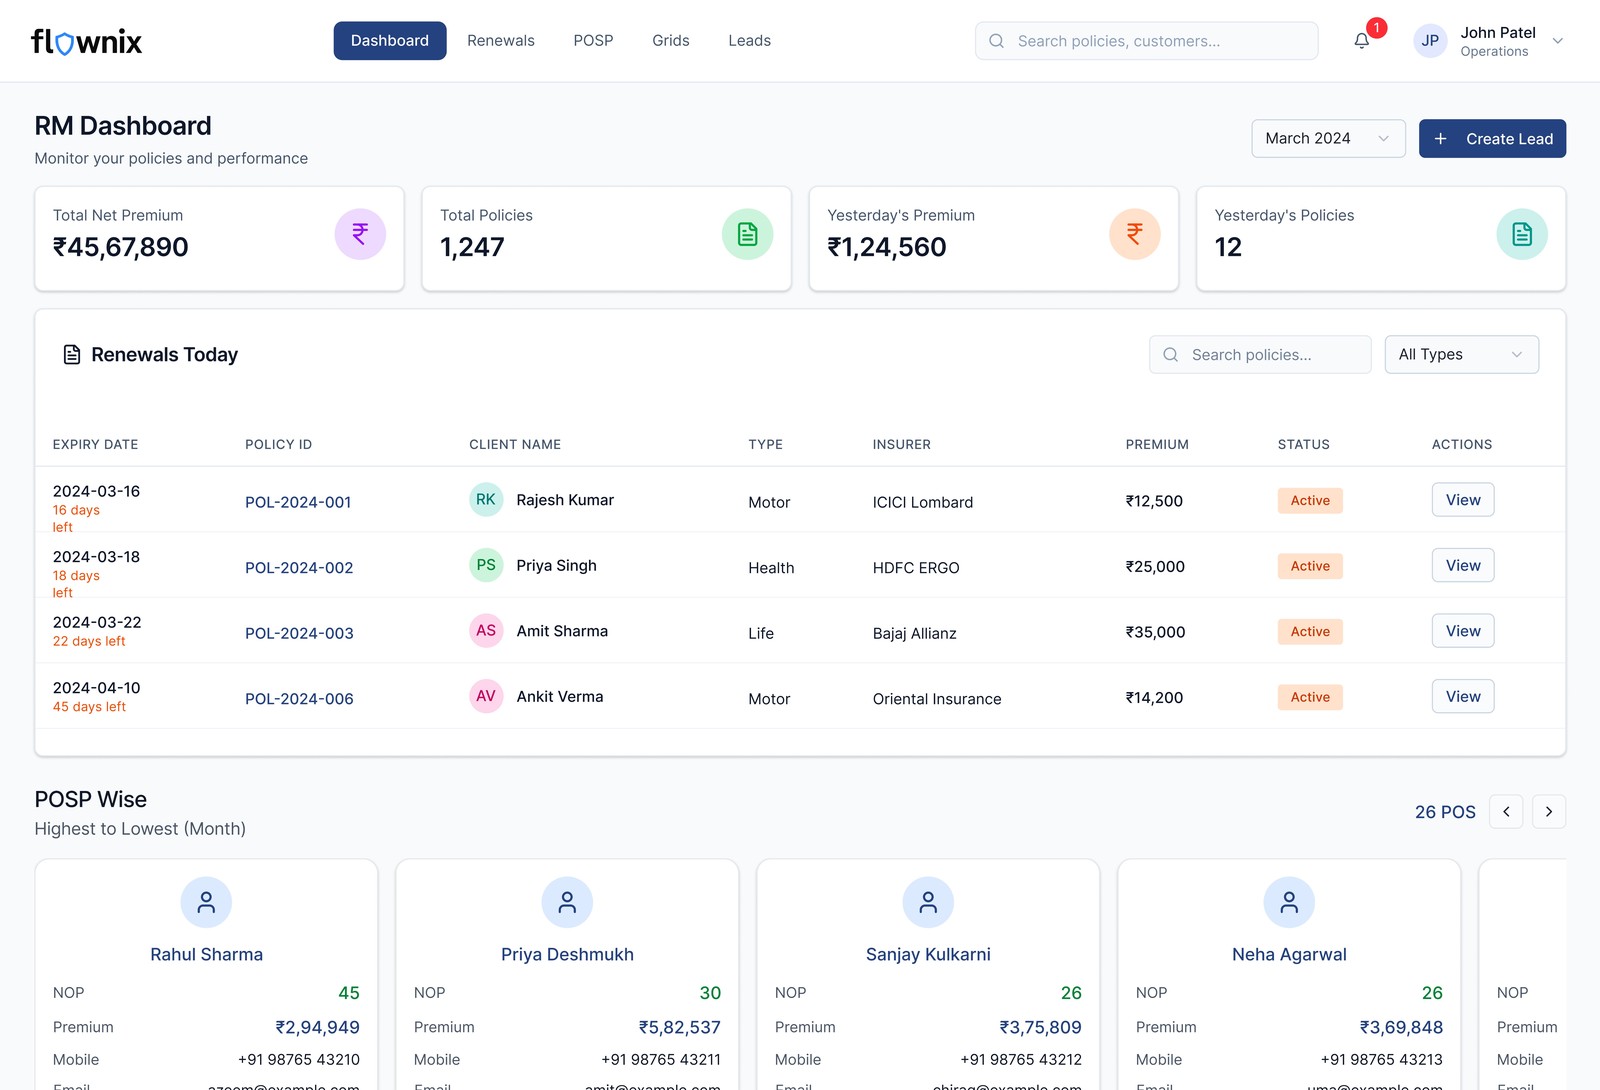
RM portal — portfolio view first
RMs manage a portfolio of agents, not individual policies. Their primary view is a sortable agent list with inline performance indicators — so they can spot underperforming agents at a glance and drill in where needed. Lead oversight gives them visibility into what agents are pursuing, without requiring agents to file reports.
How AI tools helped me move faster without losing quality
This was one of the first projects where I systematically integrated AI tools into the design process — and it meaningfully changed how quickly I could iterate, especially across four portals simultaneously.
On a solo project spanning 4 portals in 1.5 months, AI tools effectively gave me the ability to explore more directions before committing. Figma Make for layout exploration and Vercel v0 for interaction prototyping compressed what would normally be 2–3 days of exploration into a few hours — leaving more time for the decisions that actually required design judgment.
What shipped and what the client said
"The design is much simpler to navigate and use."— Client, InsureTech project
The "simpler to navigate" feedback is significant in context — the platform covers considerably more functionality than what agents were using before. Covering more ground while feeling simpler is the outcome I was designing toward from the start.
What I'd do differently
"If I had more time…"
The biggest gap in this project was direct time with actual POSPs — working agents who sell insurance daily. Most of my understanding of the agent workflow came through stakeholder conversations, not observed behaviour. Watching a POSP work through their morning routine — checking renewals, following up on leads, issuing a new policy — would have surfaced friction points that requirements conversations don't reveal.
I also would have liked to run usability testing on the policy issuance flow specifically, because it's the highest-stakes interaction in the platform. An error in policy issuance has real consequences for the agent and the client. With more time, I'd have tested at least 3–4 POSP users through the complete issuance flow before handoff.
Finally, the lead management module was designed based on a relatively simple pipeline model. In reality, insurance lead conversion can be a long cycle — weeks or months between first contact and policy issuance. A more nuanced follow-up and nurture flow, with customisable stages, would better reflect how experienced agents actually manage their pipeline. That's a V2 conversation worth having.